Rebuilding My Proxmox Homelab from Scratch — Part 2: Wazuh SIEM
- date
- read
- 6 min
- tags
- homelab · proxmox · security · wazuh
- series
- Proxmox rebuild, part 2 of 2
After getting Tailscale running in part 1, the next thing I wanted was a robust SIEM solution to play around with. So the next step was deploying Wazuh.
Understanding Wazuh
Before I touched anything, I went straight to the official documentation to actually understand what I was deploying. I’ve made the mistake before of just following a guide without knowing what each piece does, and it always comes back to bite me.
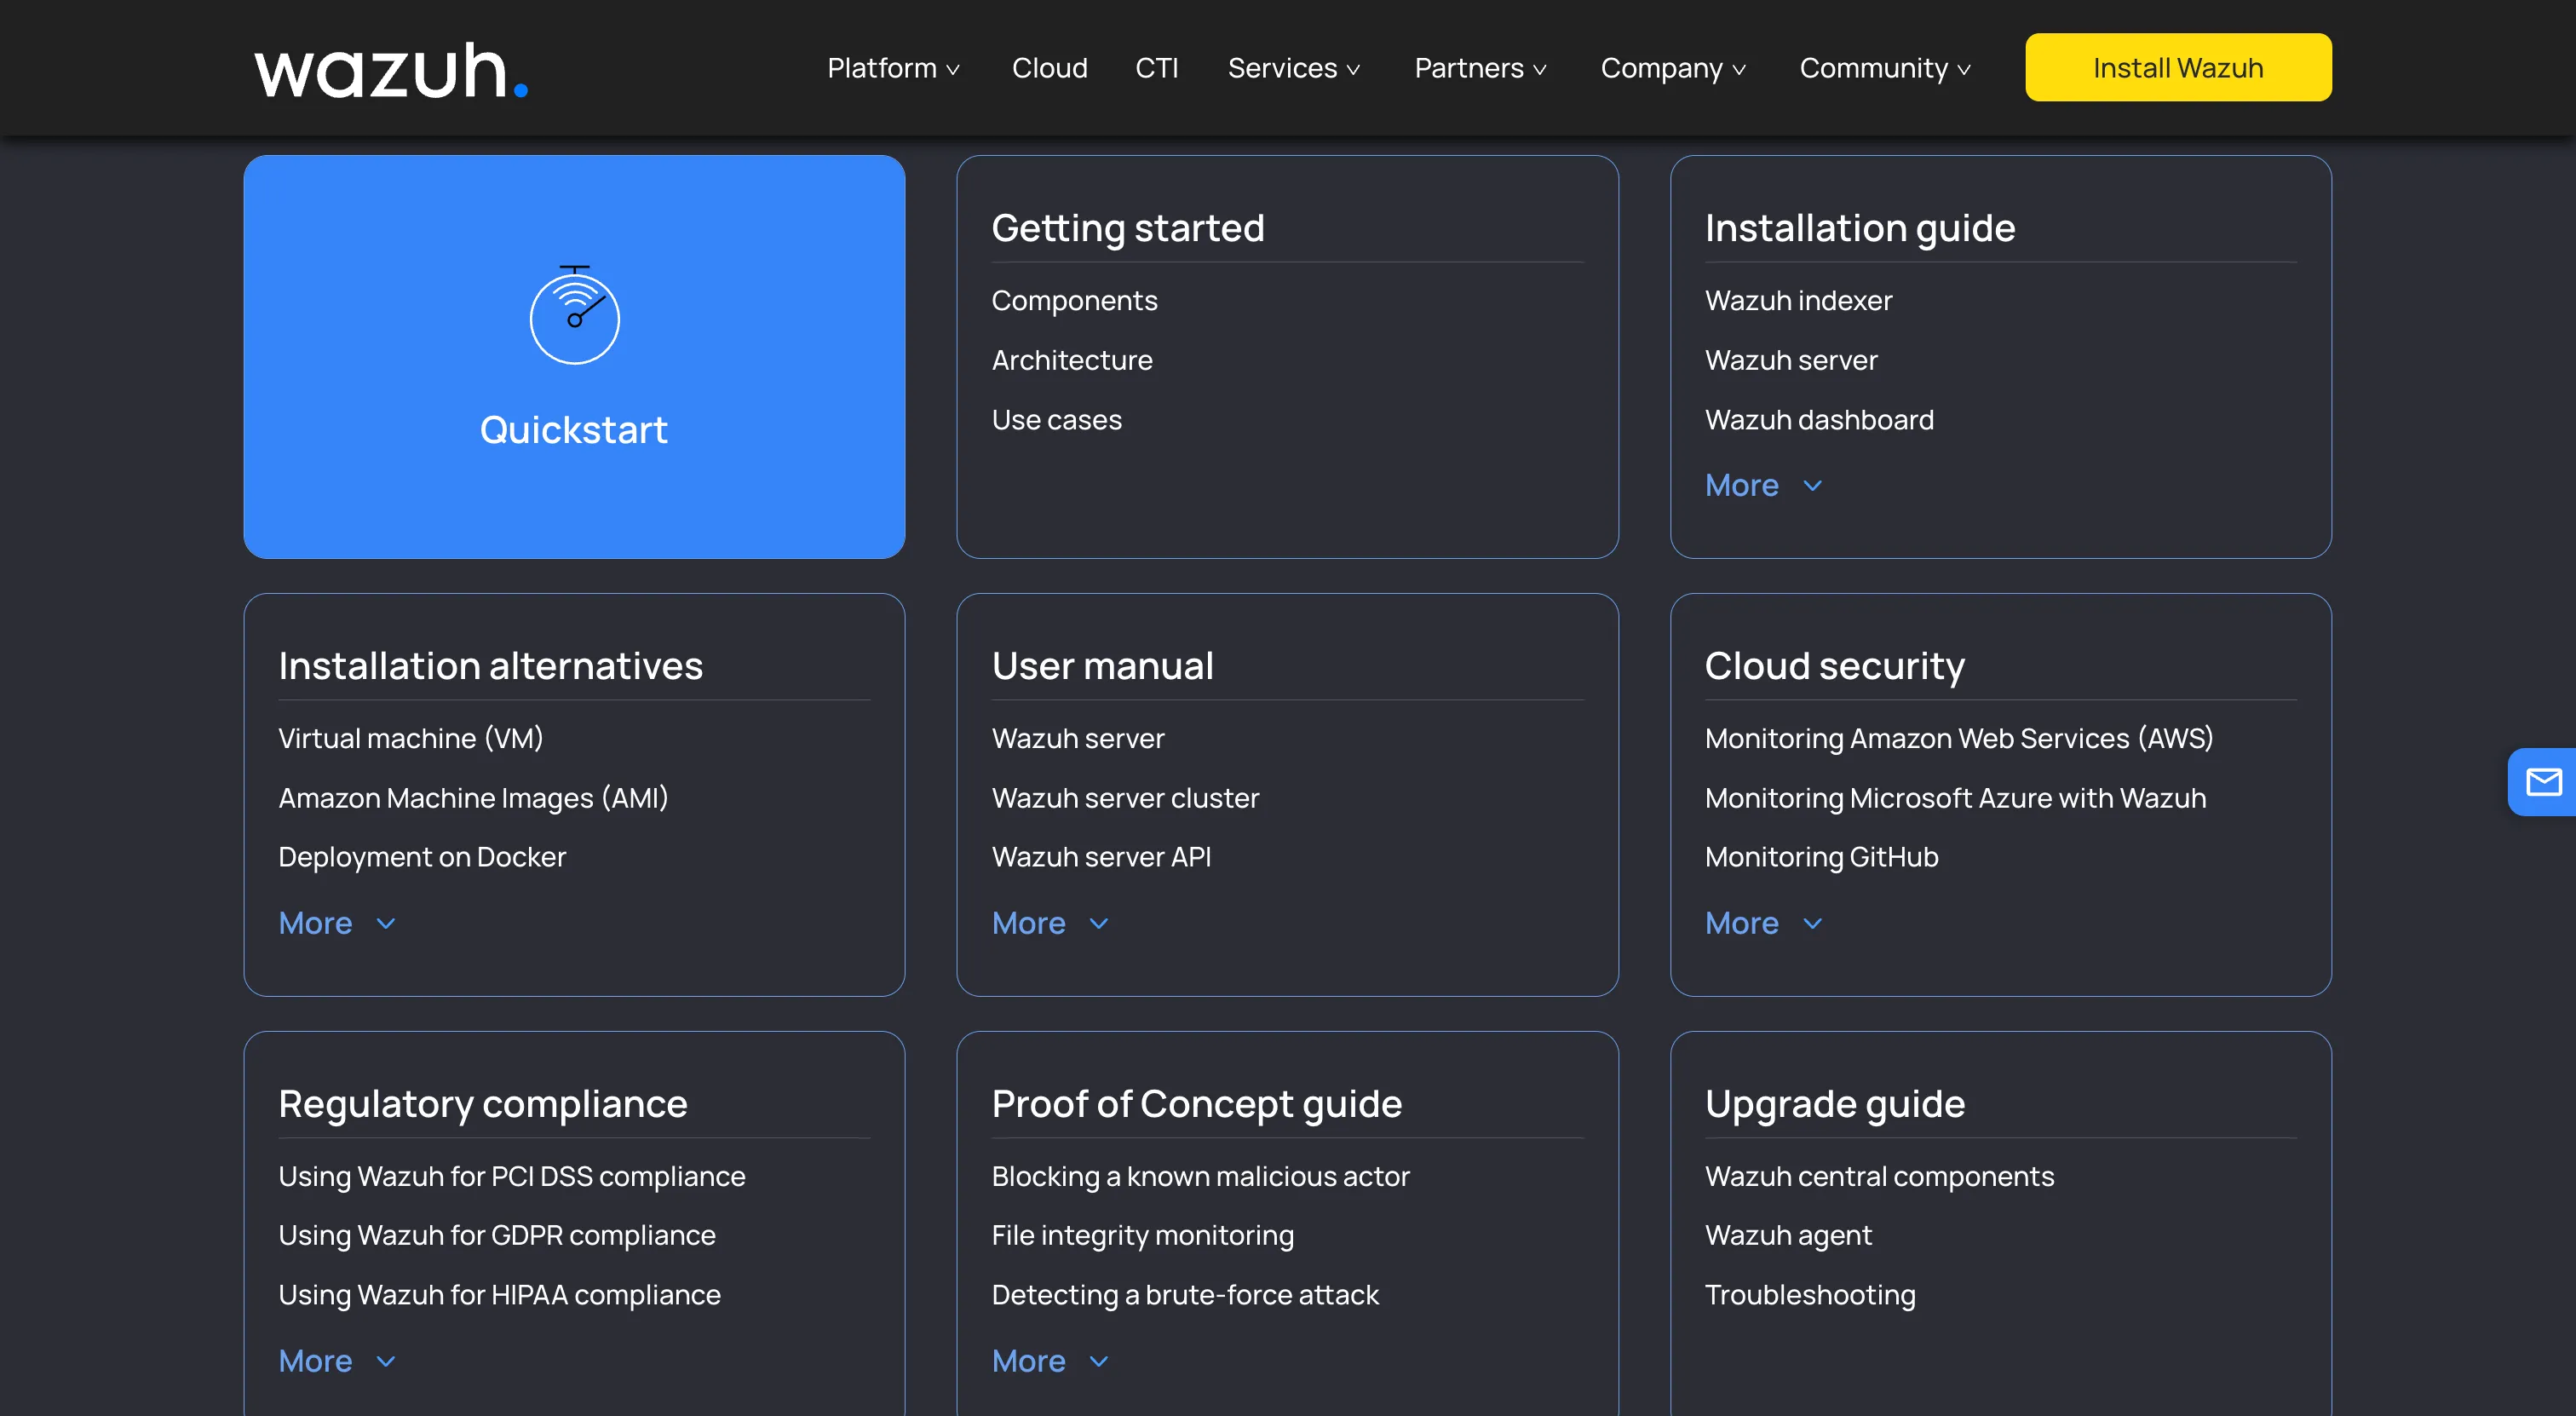 The Wazuh official documentation. I started here before doing anything else. The architecture section lays out all four components and how they relate to each other.
There are four components to the Wazuh stack:
Wazuh Indexer stores the data. It’s an OpenSearch-based component that stores everything as JSON documents. Near real-time, low latency. Think of it as the database layer.
Wazuh Server is the brain. It takes data collected from agents and agentless devices, runs threat detection, anomaly detection, and compliance checks, and fires alerts when something looks off. It also handles remote agent management, which is nice.
Wazuh Dashboard is the web UI. This is where you actually see everything.
Wazuh Agent runs on the monitored endpoints. It collects logs, monitors file integrity, detects rootkits, and ships everything back to the server.
The server architecture looks like this:
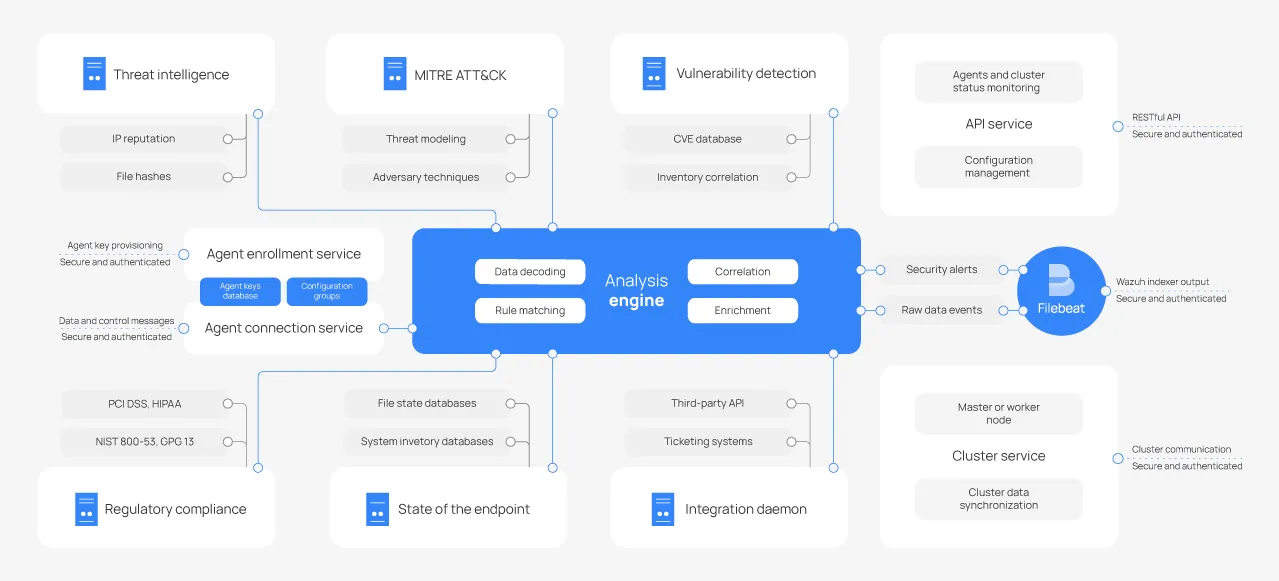 Wazuh Server architecture from the official docs. The manager sits at the center, handling agent communication via port 1514. The Wazuh Indexer stores and indexes the processed events.
And the agent side:
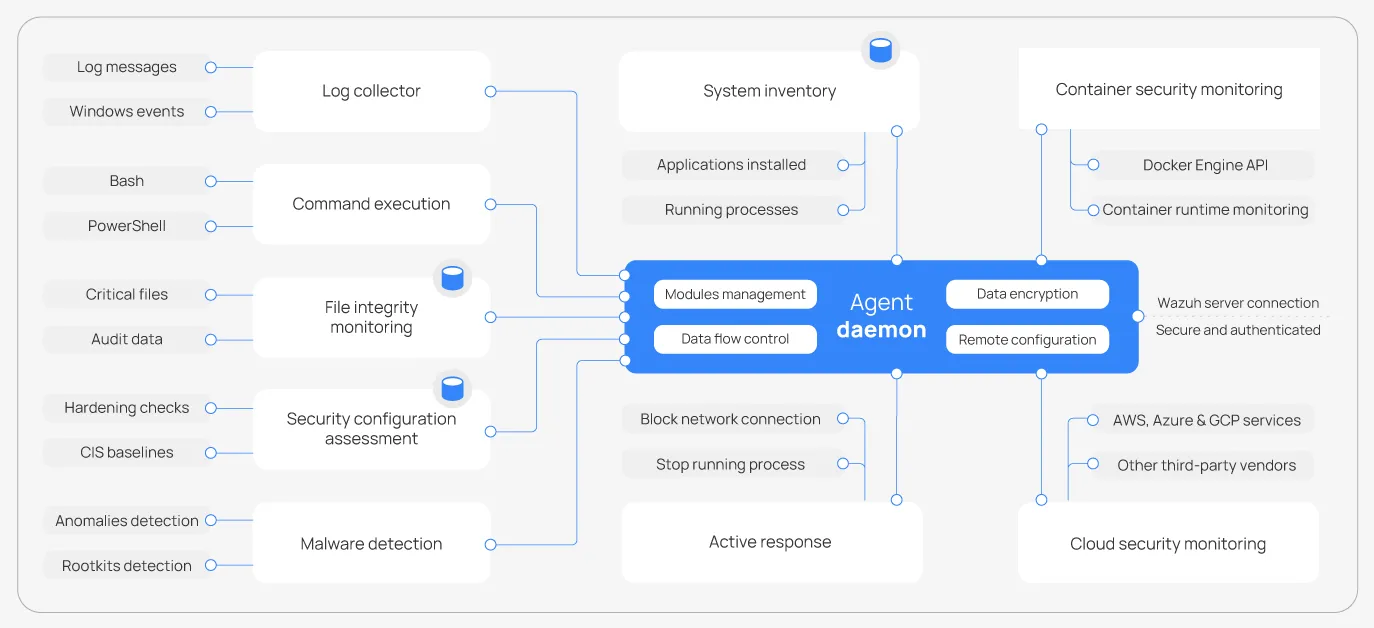 Wazuh Agent architecture. The agent runs several modules in parallel including the log collector, file integrity monitor, rootcheck, and the syscollector. Everything funnels through the agent daemon which handles communication back to the server.
For my homelab, I went with an all-in-one deployment. Wazuh Server, Indexer, and Dashboard all on the same host. A distributed deployment would be overkill for what I’m doing here.
Let’s Begin
The first thing I needed was a VM. Wazuh officially supports Ubuntu 24.04 LTS, so that’s what I went with. I downloaded the ISO, added it to Proxmox, and configured the VM.
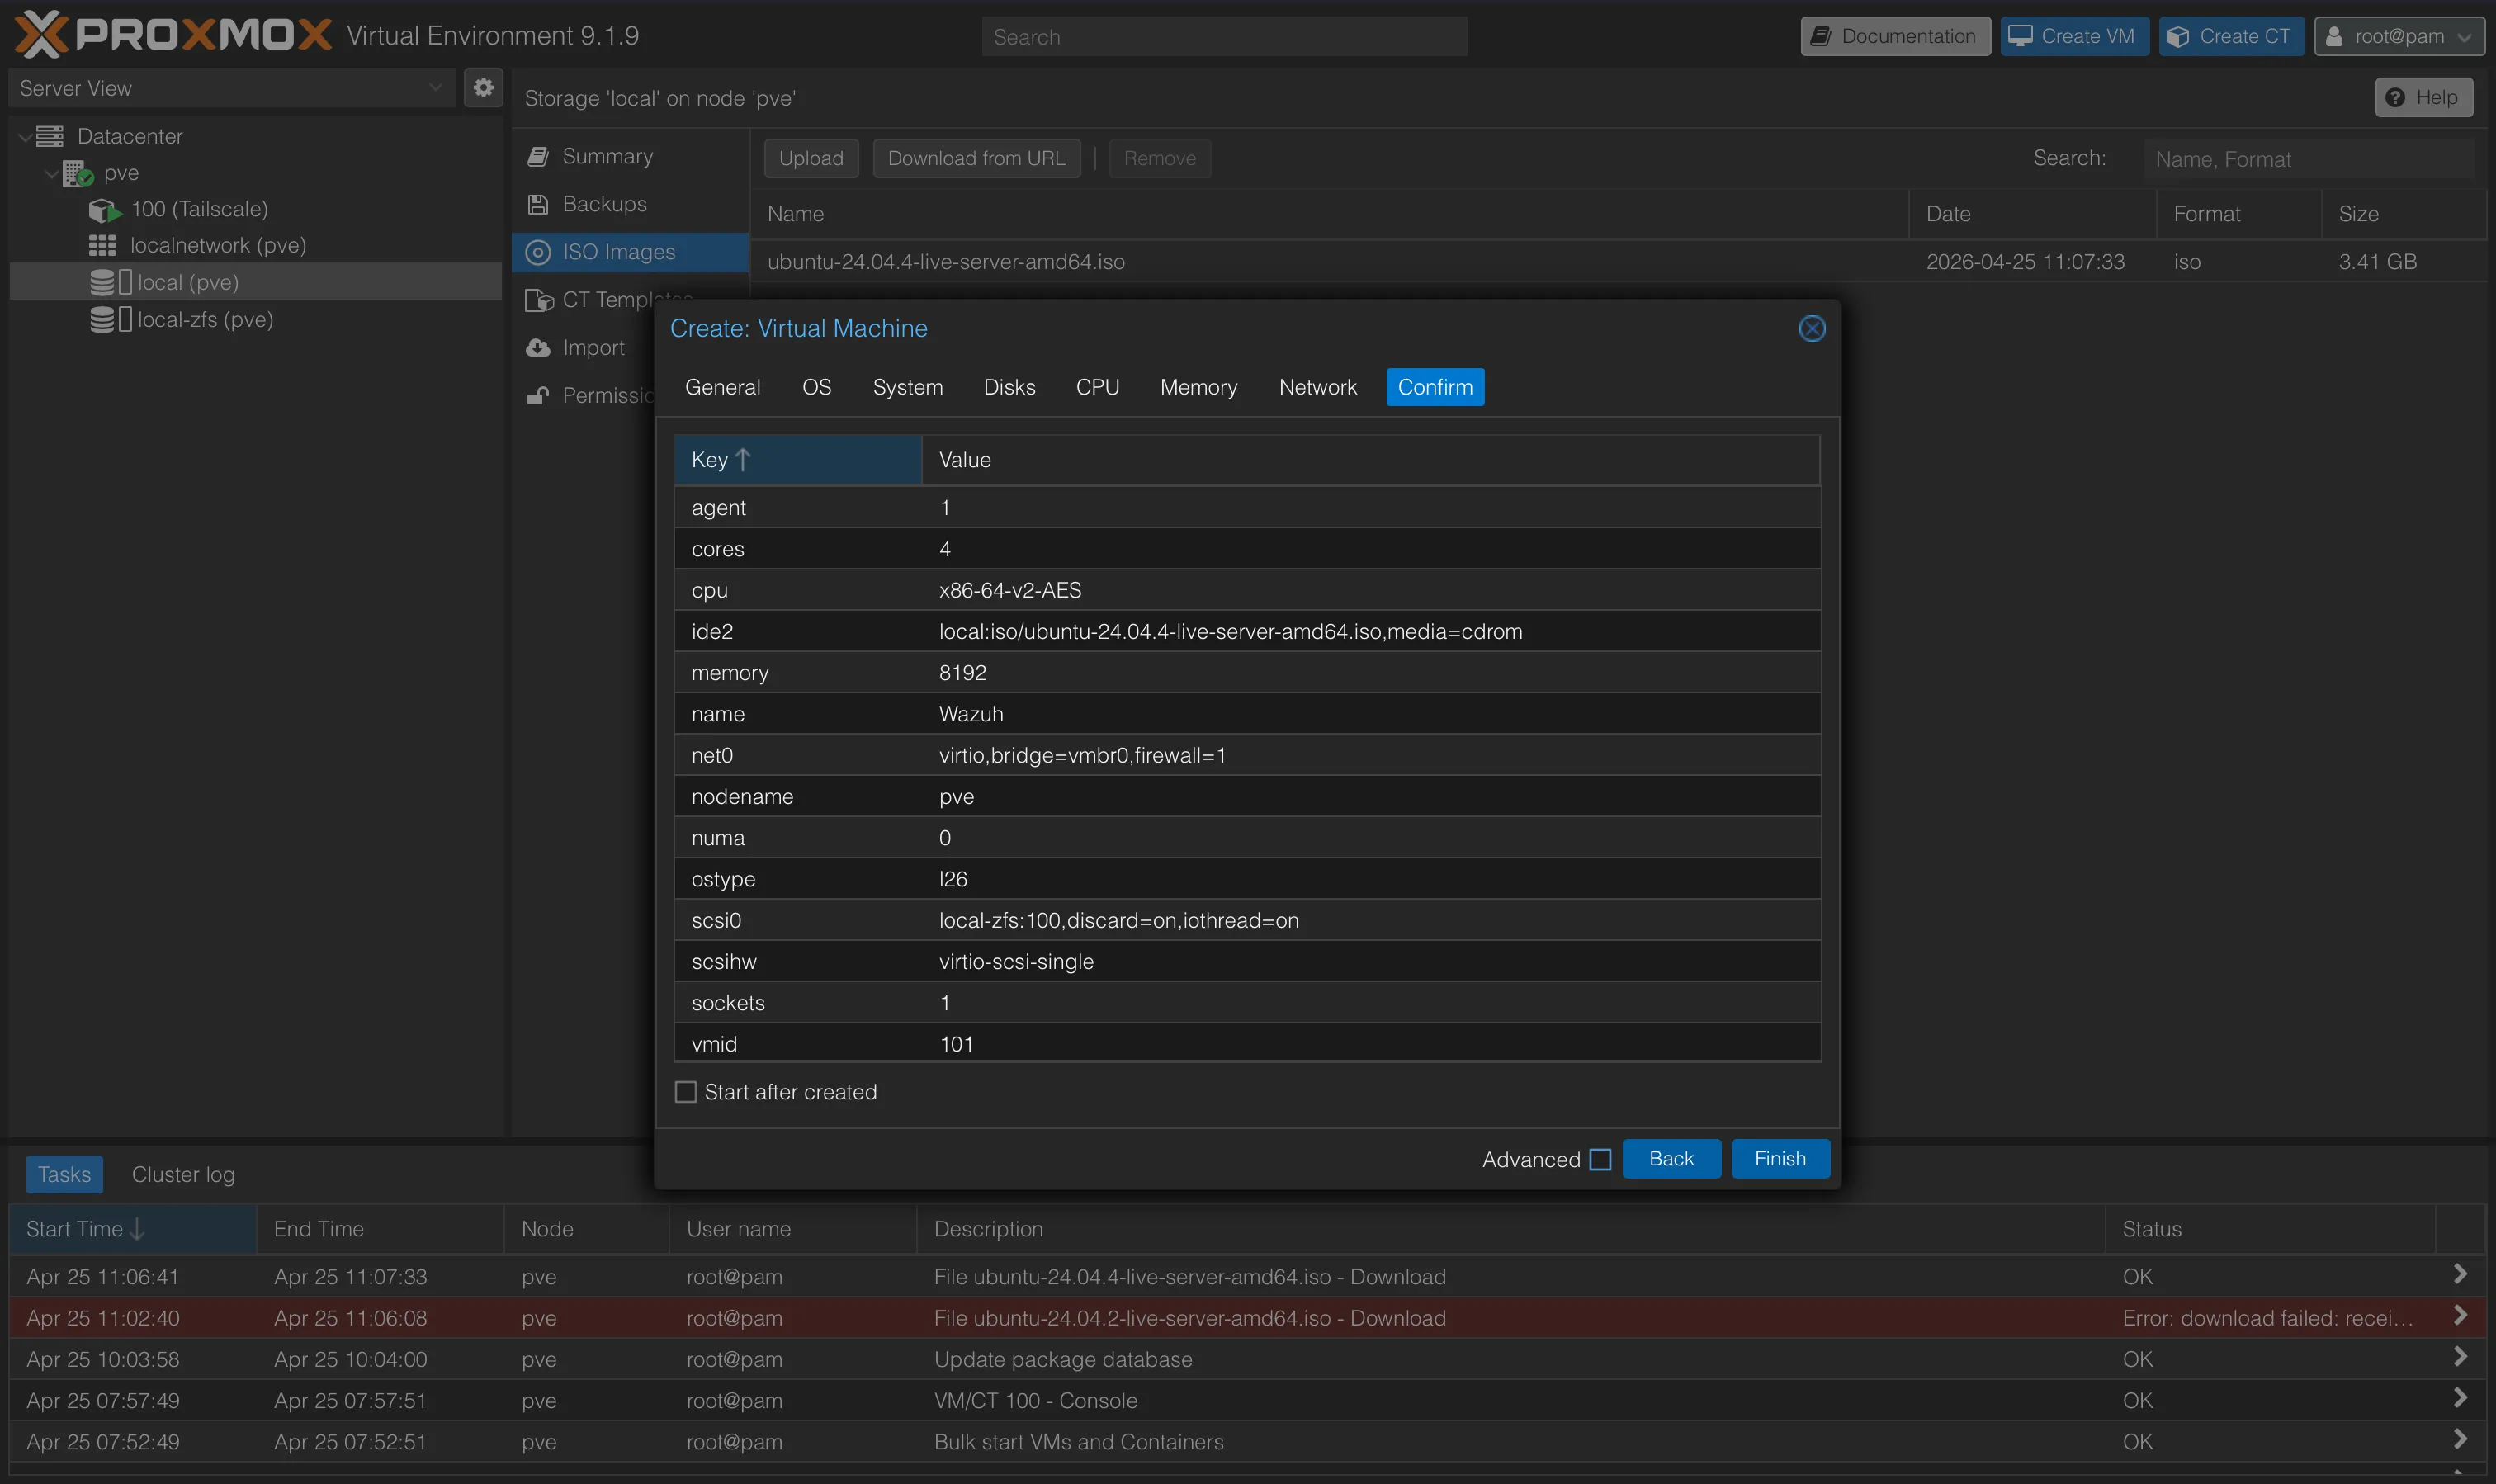 Proxmox VM configuration for the Wazuh host. 4 cores, 8GB RAM, 100GB disk on local-zfs. Ubuntu 24.04 LTS ISO attached and ready to boot.
During the Ubuntu Server install, I set a DHCP reservation in my Xfinity gateway admin interface first, then assigned it as a static IP inside the Ubuntu installer. I learned from part 1 that skipping the static IP during install and trying to fix it after is just unnecessary pain.
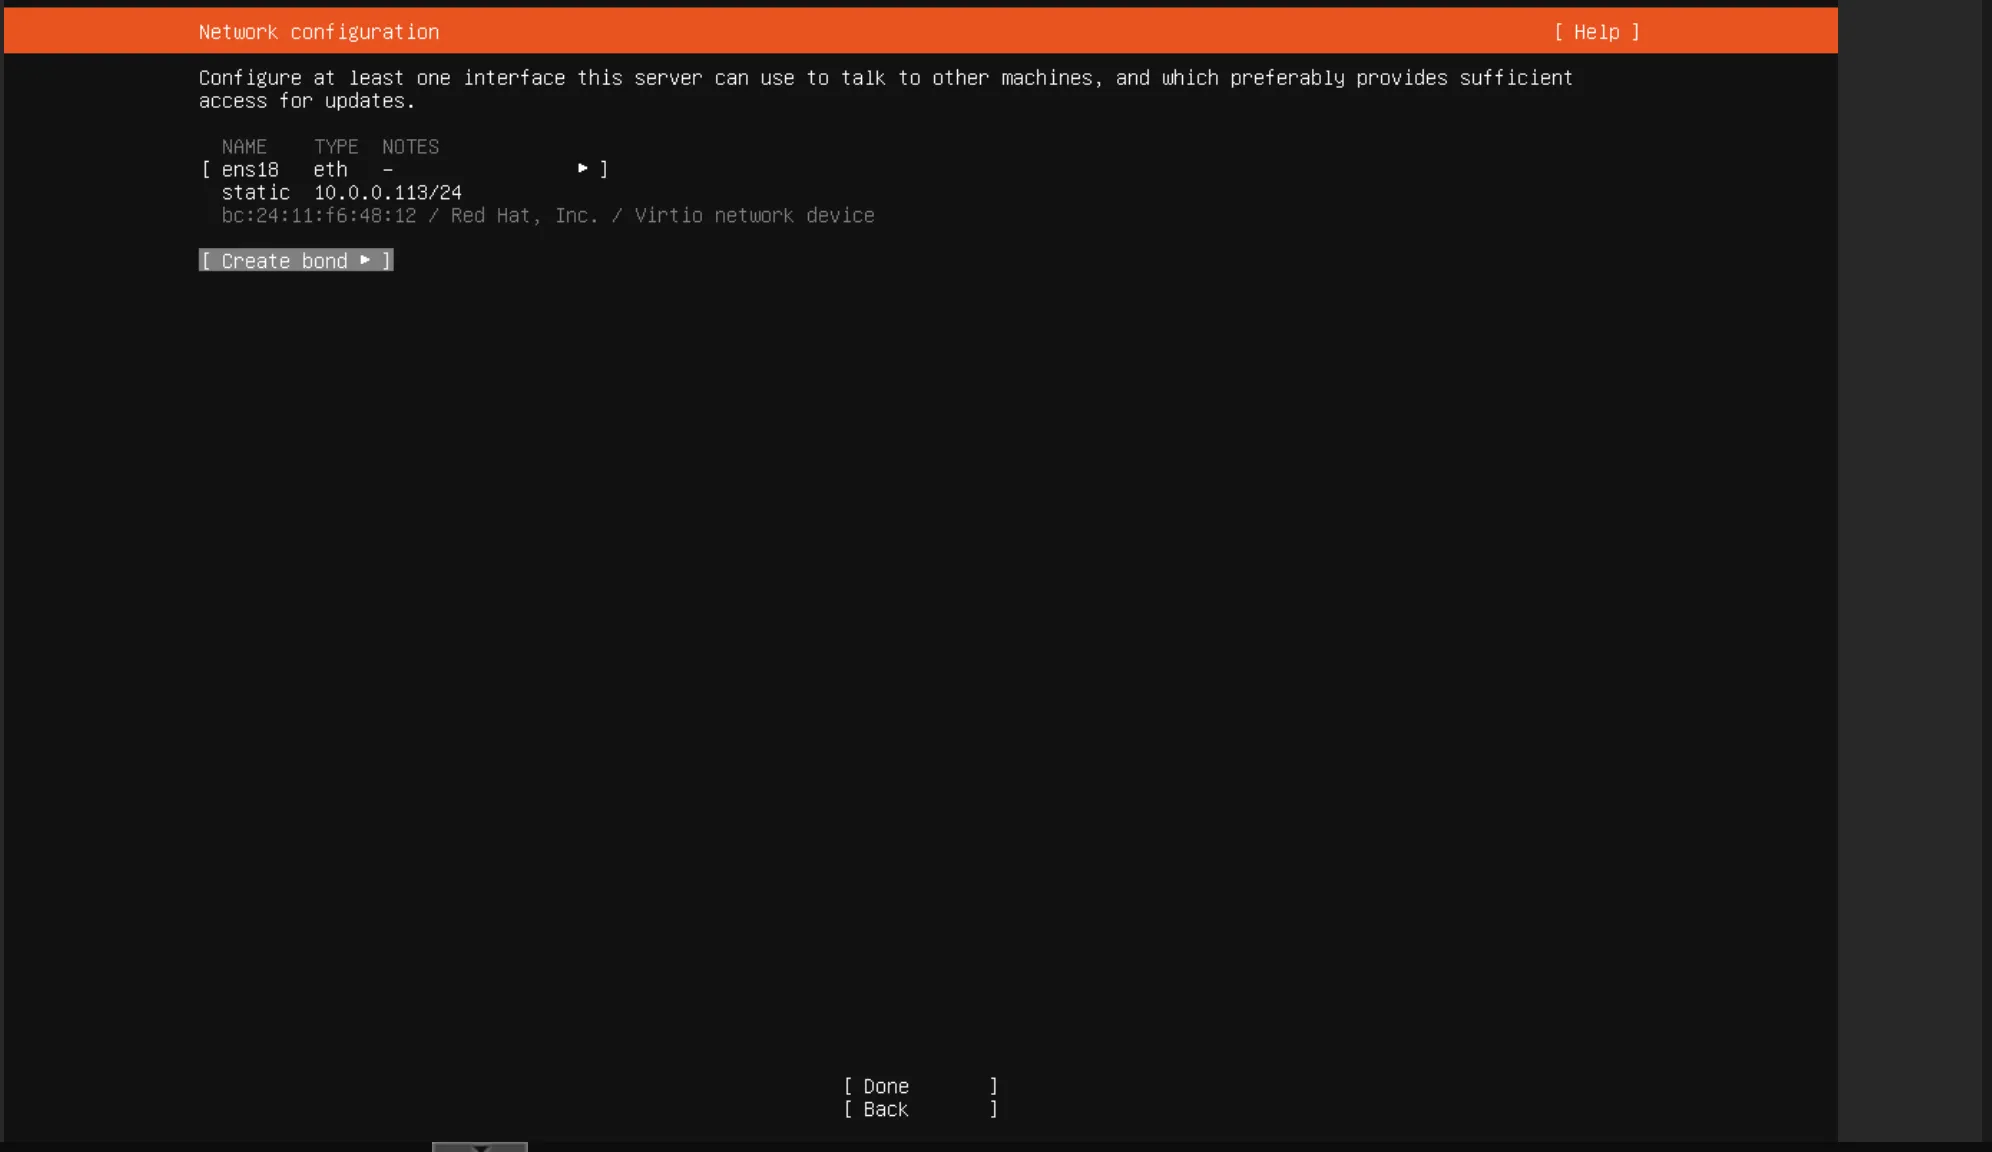 Ubuntu Server network configuration screen during install. Manually setting the static IP, subnet mask, gateway, and DNS. Did this right the first time this go around.
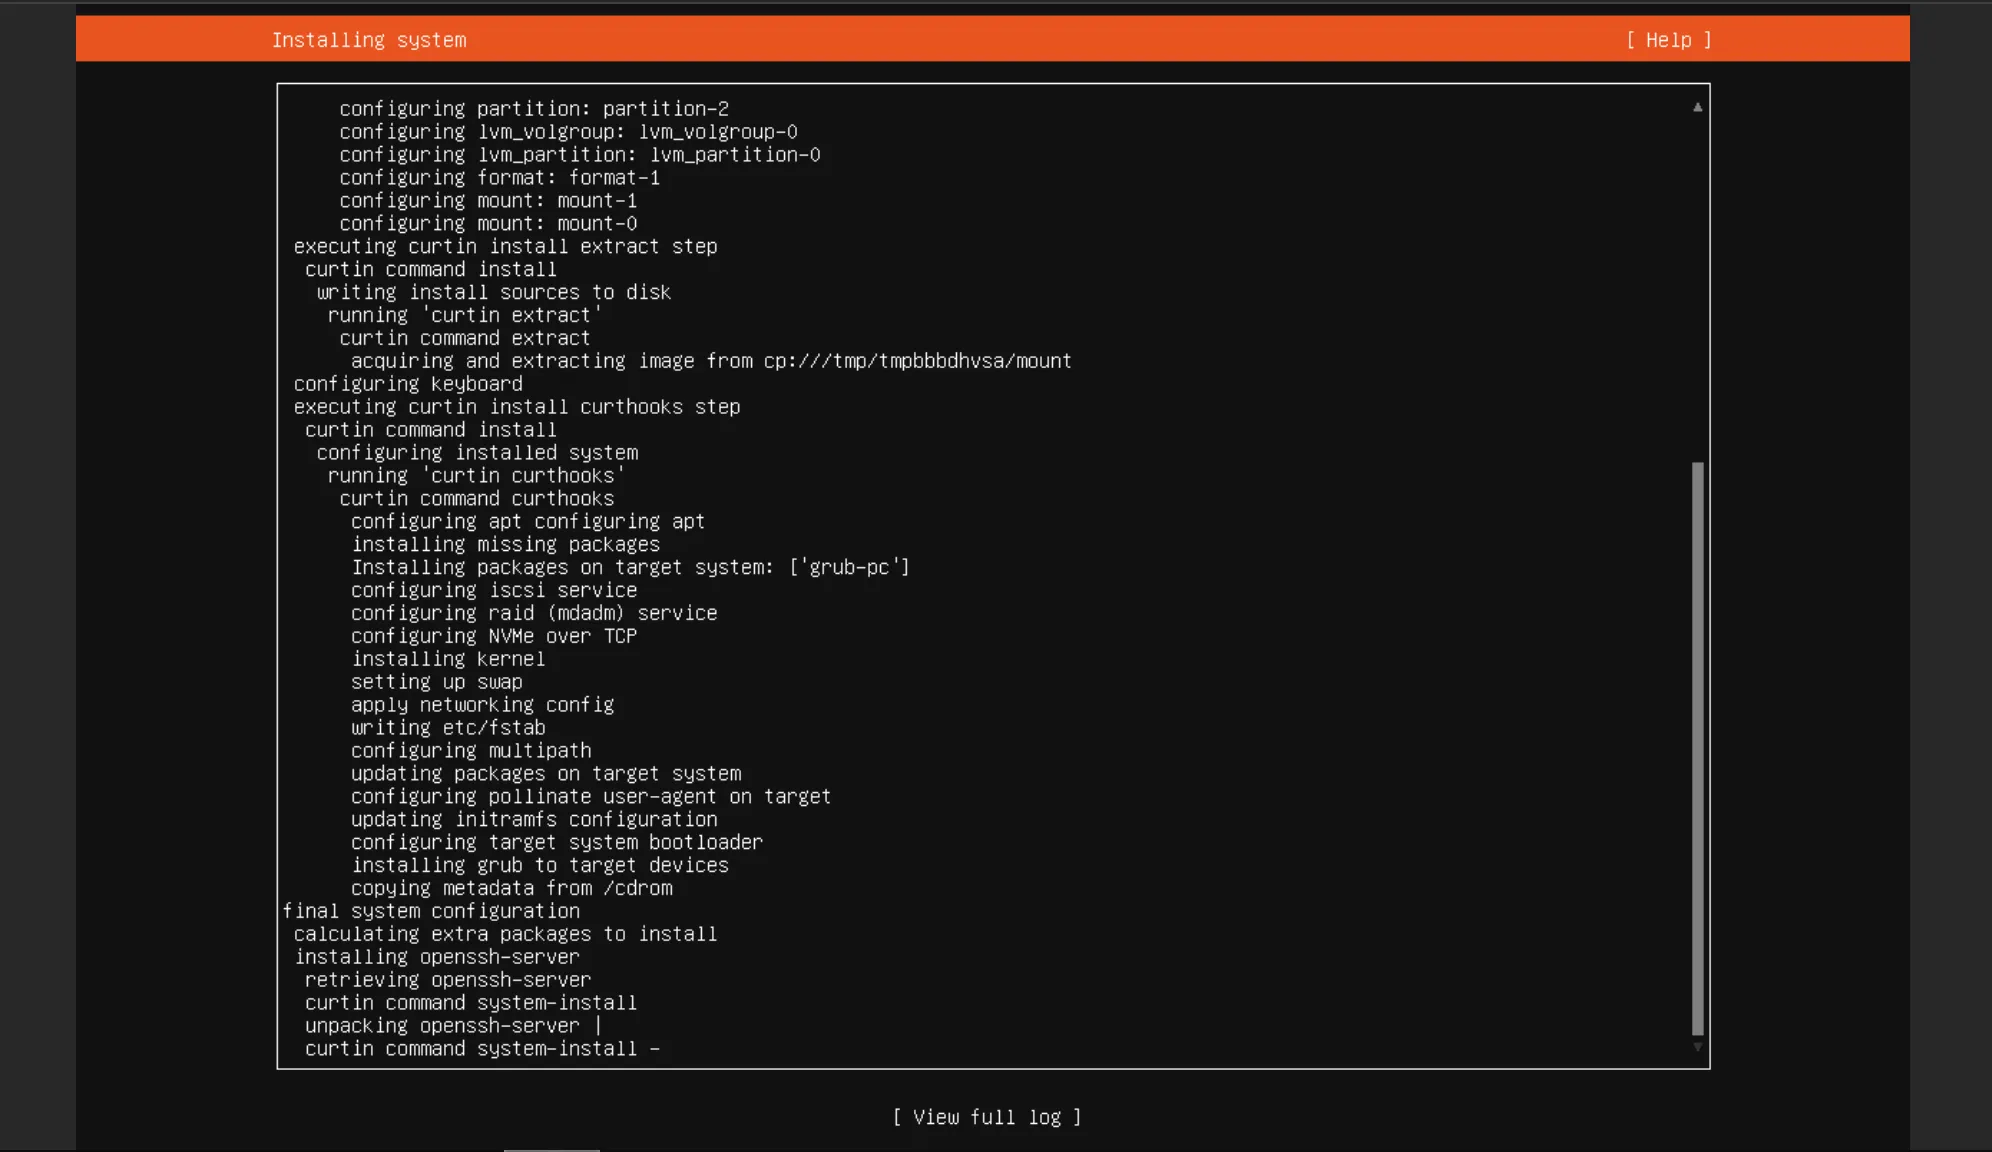 Ubuntu Server 24.04 LTS installation in progress. Profile setup, SSH enabled, no extra snaps selected.
The LVM Problem
After the install finished and I booted the VM, I ran df -h and immediately noticed something was off. Ubuntu’s LVM only carved out around 50GB of the 100GB I allocated. The other half was just sitting there, unallocated.
This is actually a well-known Ubuntu quirk where the LVM logical volume doesn’t automatically claim the full disk. Annoying, but an easy fix. I SSH’d from my MacBook and ran:
sudo lvextend -l +100%FREE /dev/ubuntu-vg/ubuntu-lv
sudo resize2fs /dev/ubuntu-vg/ubuntu-lv
df -h /
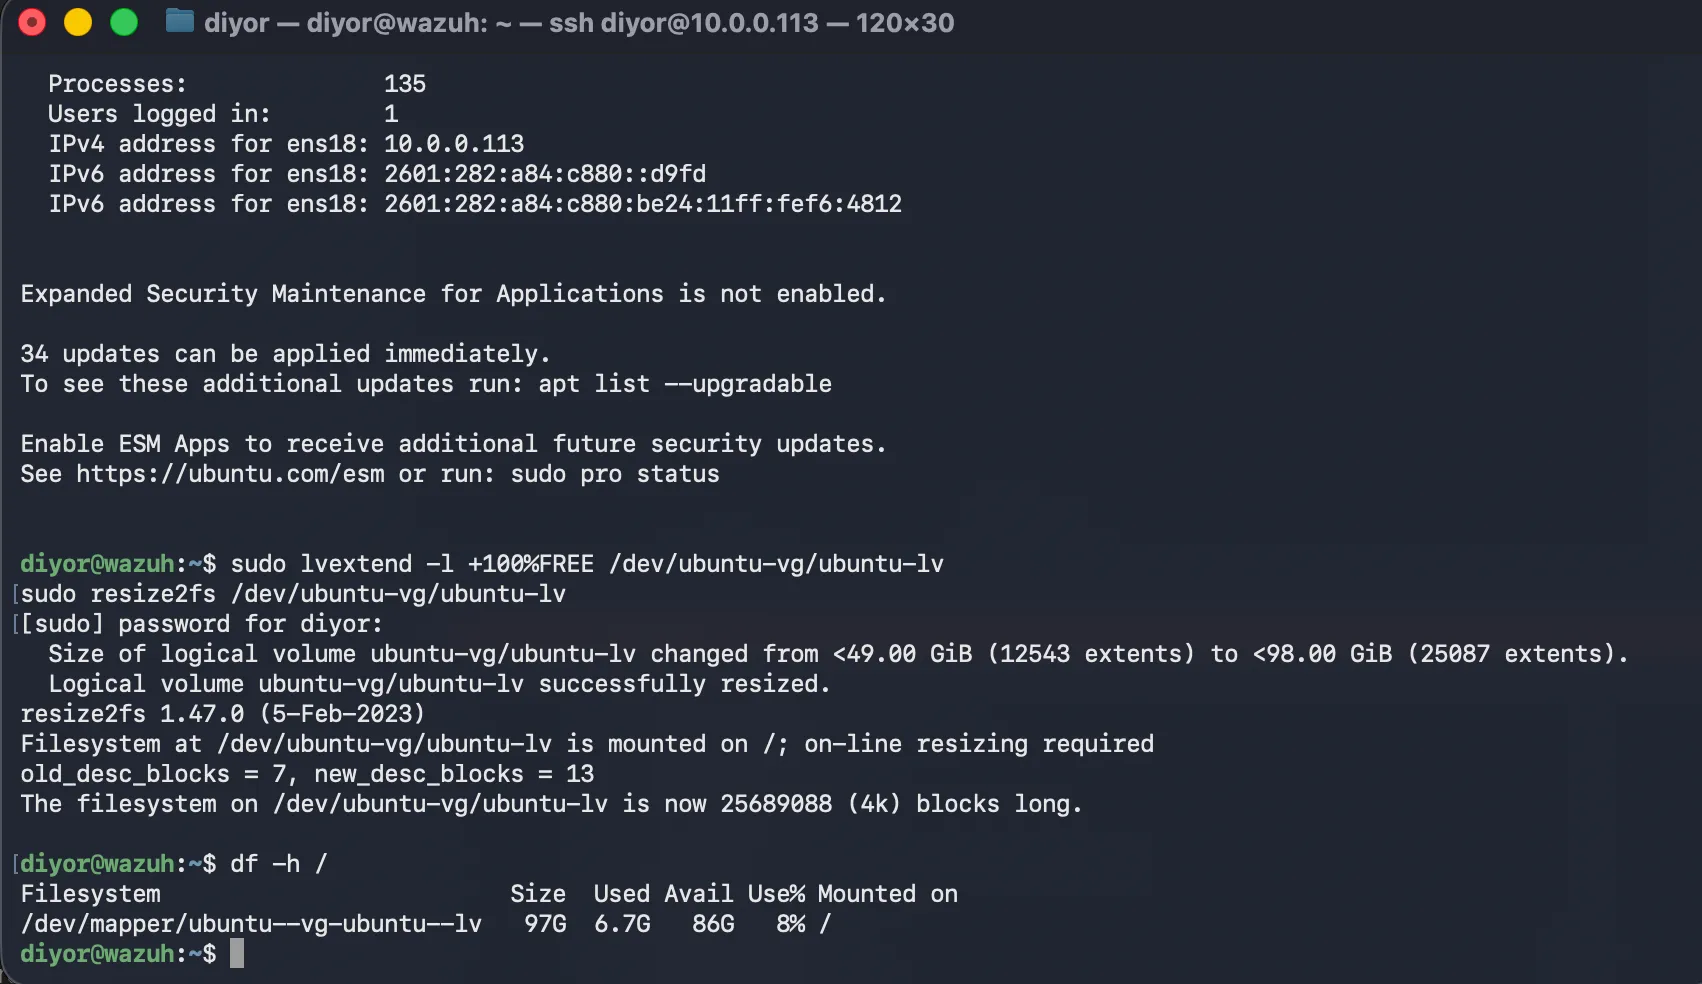 SSH session from my MacBook into the Wazuh VM. Running lvextend to claim the remaining unallocated space on the LVM, then resize2fs to grow the filesystem to fill it. The final df -h confirms the full ~98GB is now available on /.
lvextend -l +100%FREE tells LVM to grab all remaining free space in the volume group. resize2fs then tells the ext4 filesystem to expand into that newly claimed space. After that, df -h confirmed the full drive was showing up. Good to go.
Installing Wazuh
With Ubuntu sorted, I ran a quick sudo apt update && sudo apt upgrade -y to make sure everything was current, then kicked off the Wazuh installation assistant:
curl -sO https://packages.wazuh.com/4.14/wazuh-install.sh && sudo bash ./wazuh-install.sh -a
The -a flag deploys the all-in-one stack, which is exactly what I wanted. The script handles the Indexer, Server, and Dashboard in one shot. It took a few minutes to run. At the end it spits out the admin credentials for the dashboard. I copied those down immediately.
Then I opened a browser and went to https://<wazuh-vm-ip>.
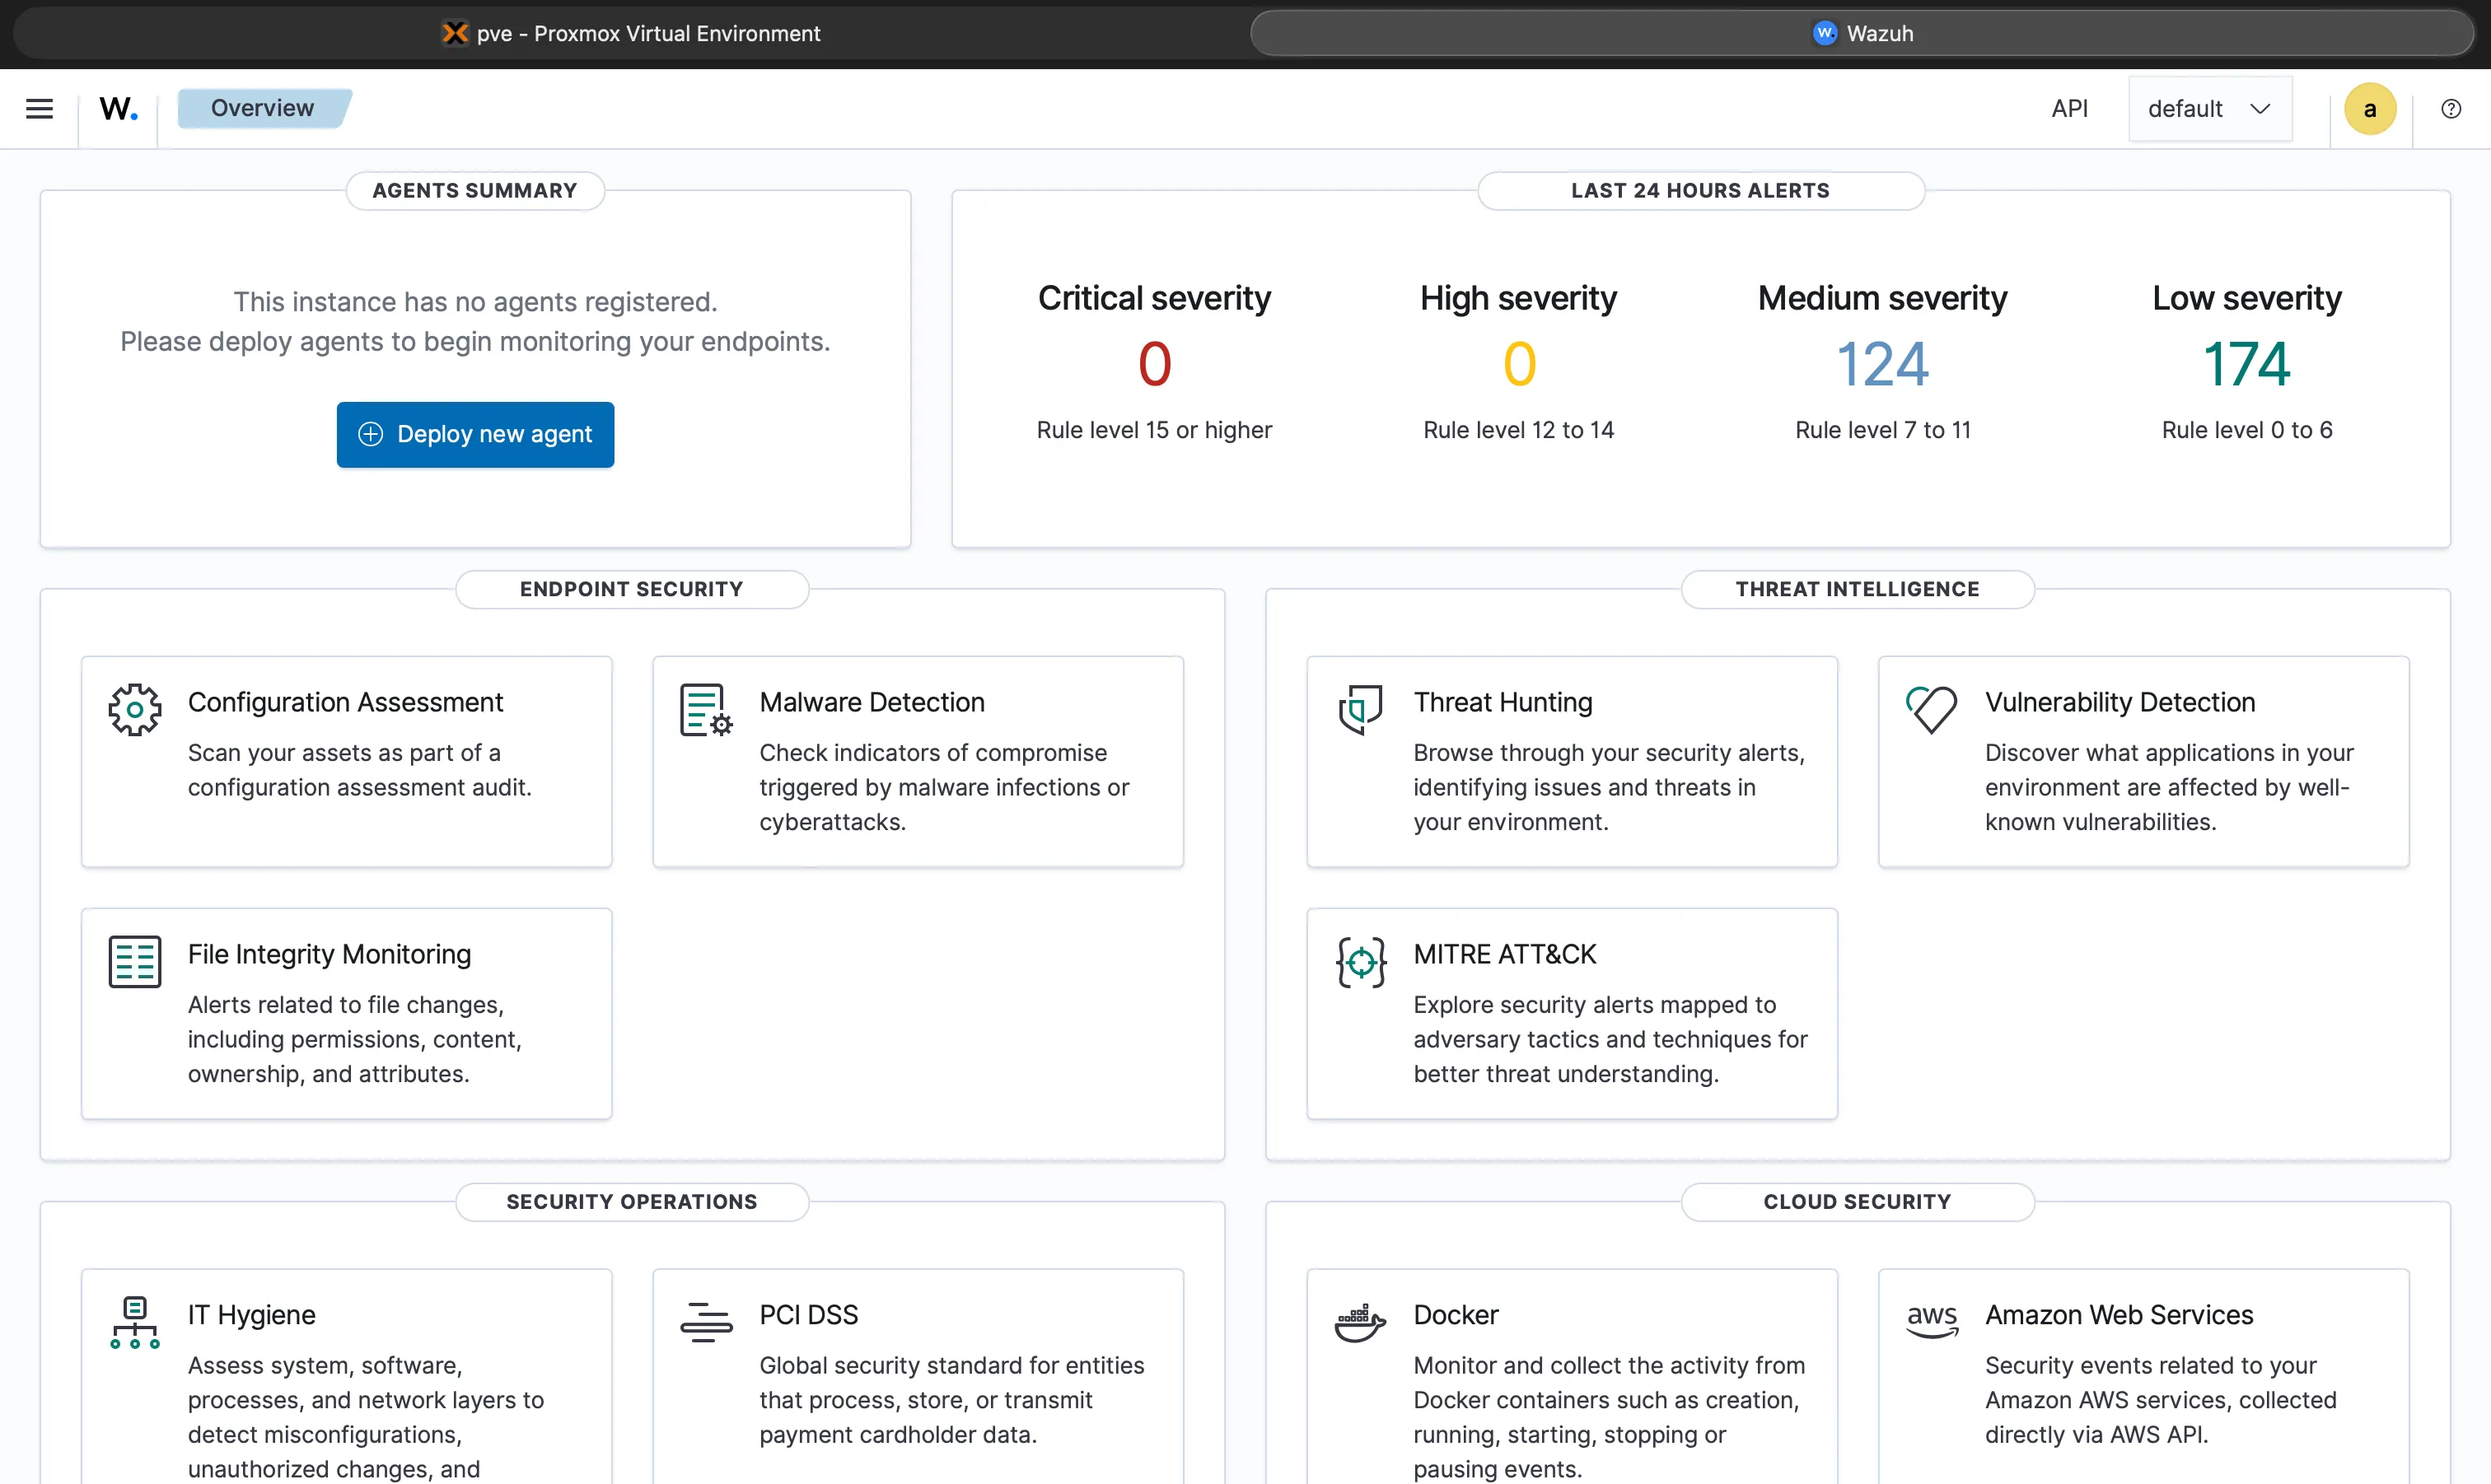 First successful login to the Wazuh web dashboard. The overview page is empty since no agents are connected yet.
And just like that, Wazuh was up!
Deploying the First Agent
A SIEM with no agents connected isn’t doing anything. The next step was spinning up a VM to monitor. I created an Ubuntu 26.04 Desktop VM to use as my first monitored endpoint.
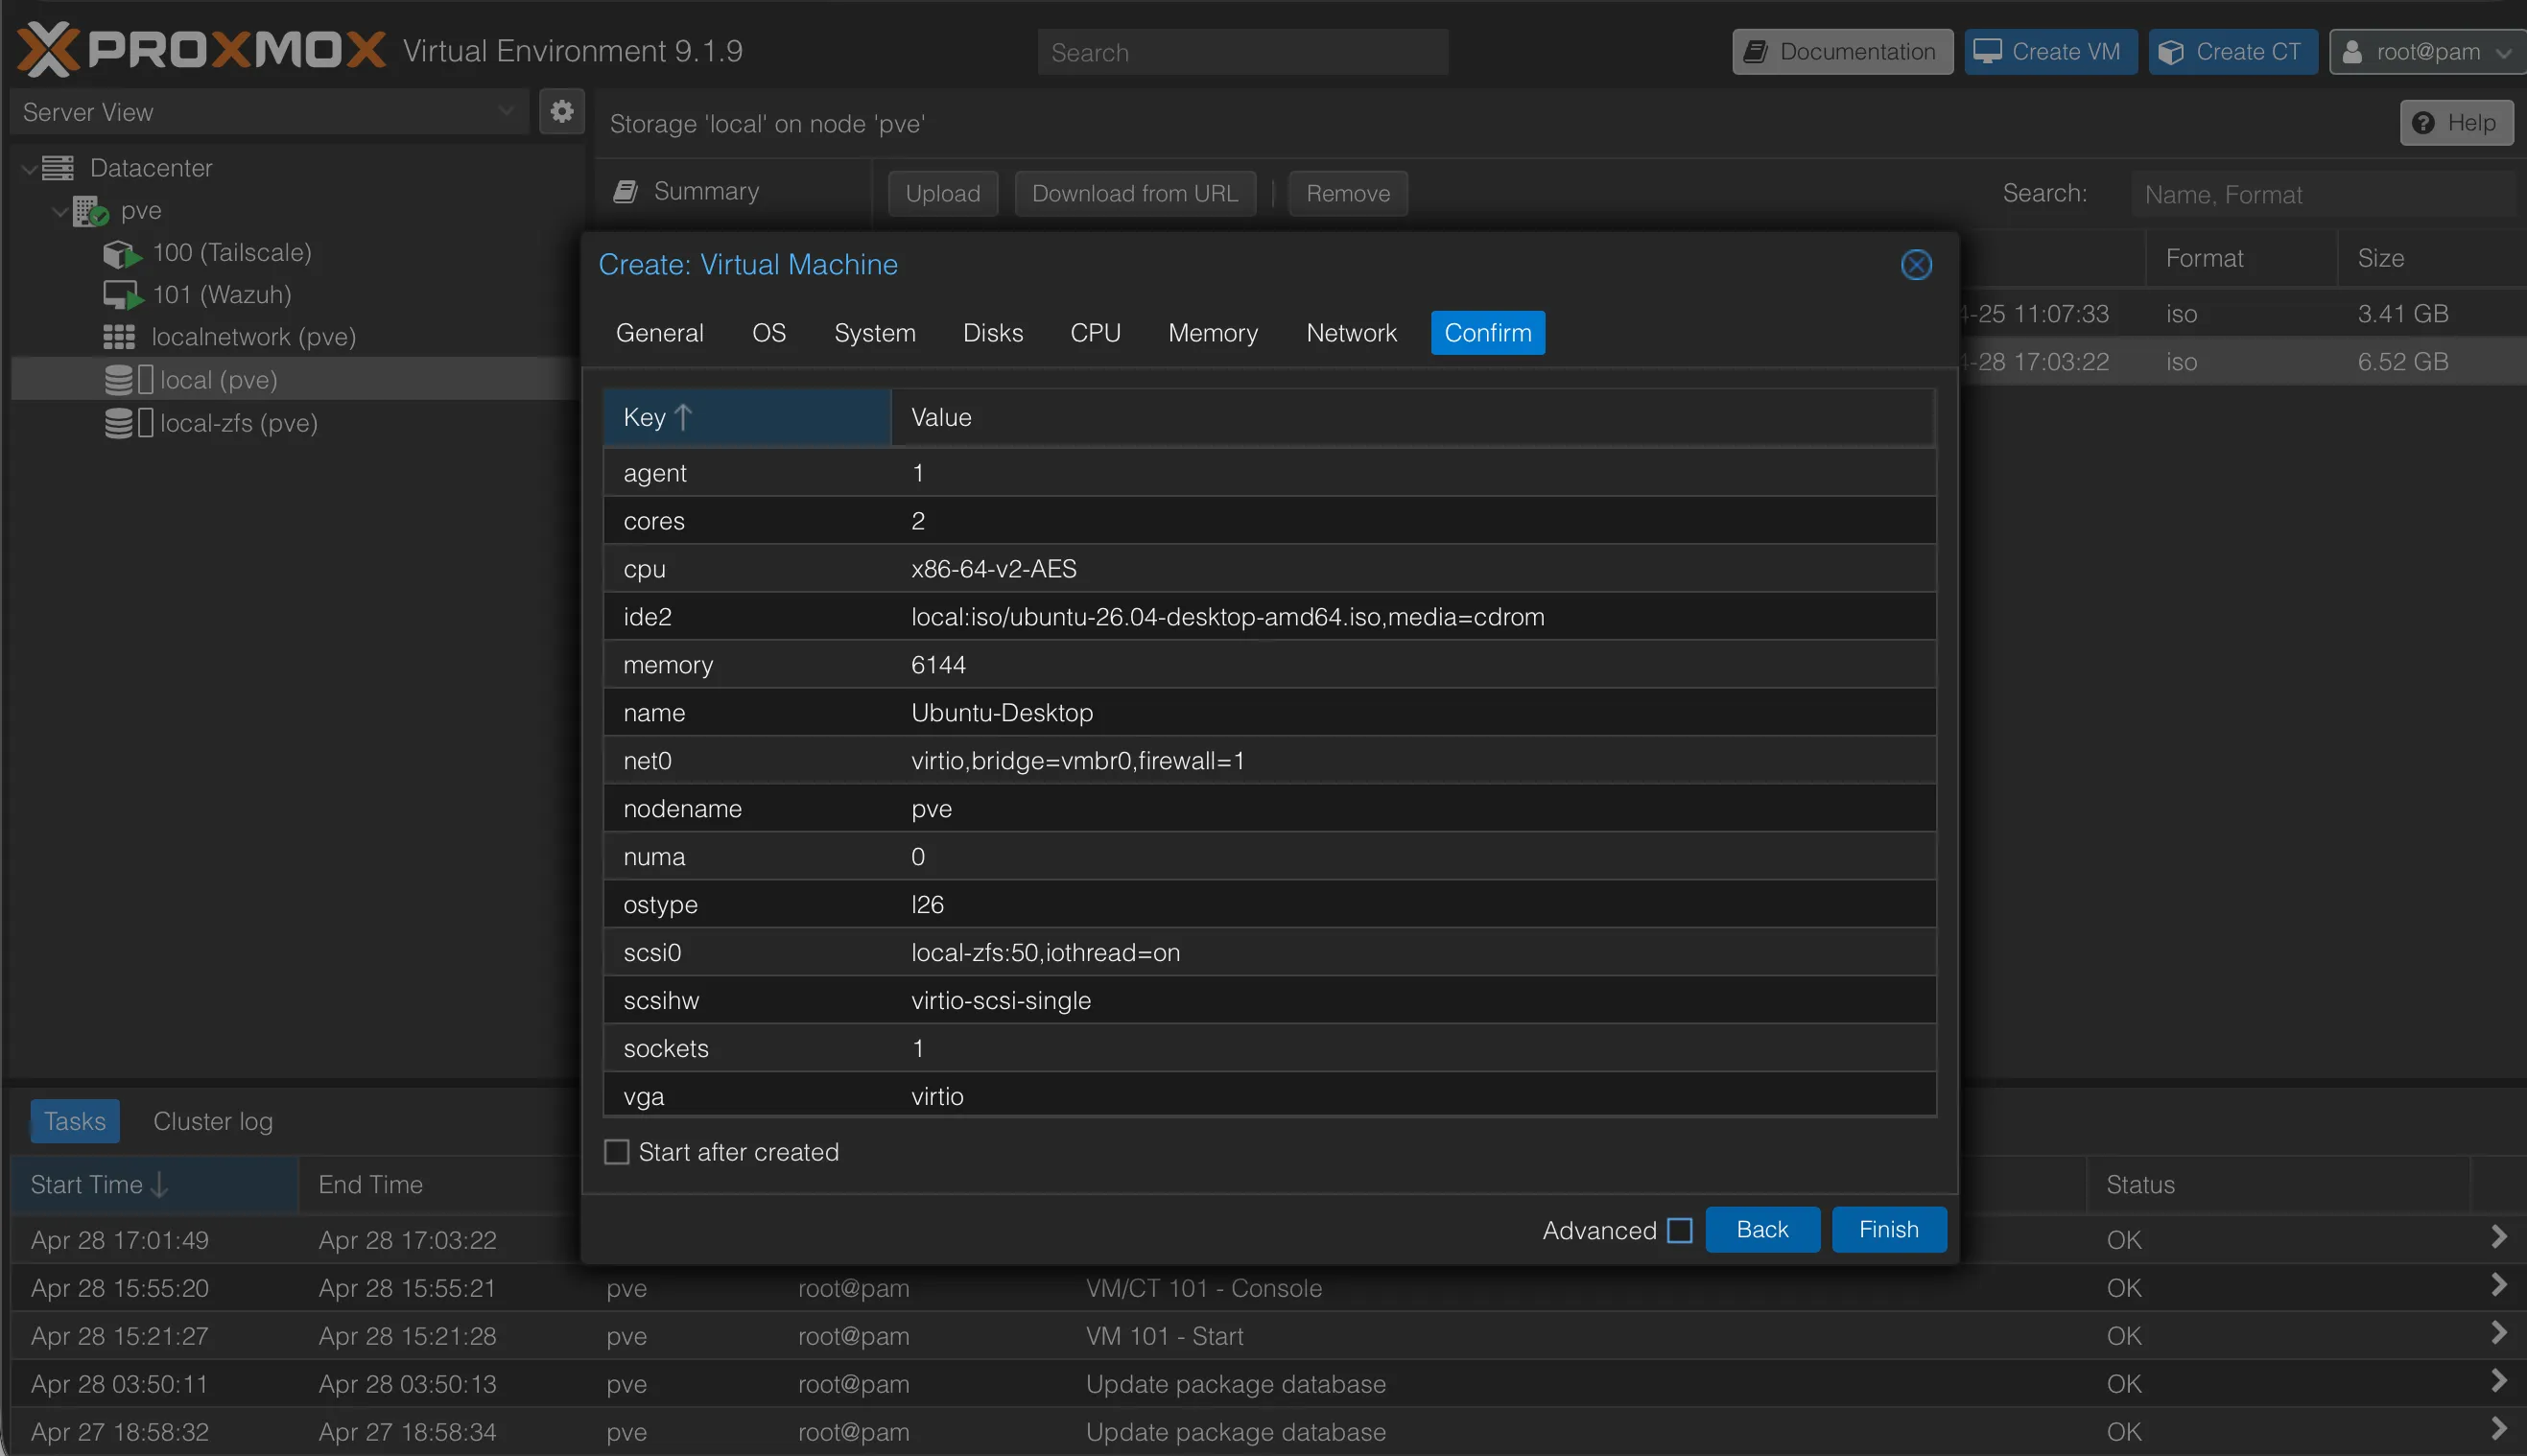 Proxmox VM summary page for the Ubuntu 26.04 Desktop VM before first boot. 2 cores, 6GB RAM, 50GB disk. This will be the first agent target.
After going through the Ubuntu installer, setting a static IP, and enabling SSH, it was time to install the agent. I SSH’d from my Mac so I could easily copy the commands in without typos.
The Wazuh Dashboard has a built-in agent enrollment flow that generates the exact commands you need. I ran those on the Desktop VM:
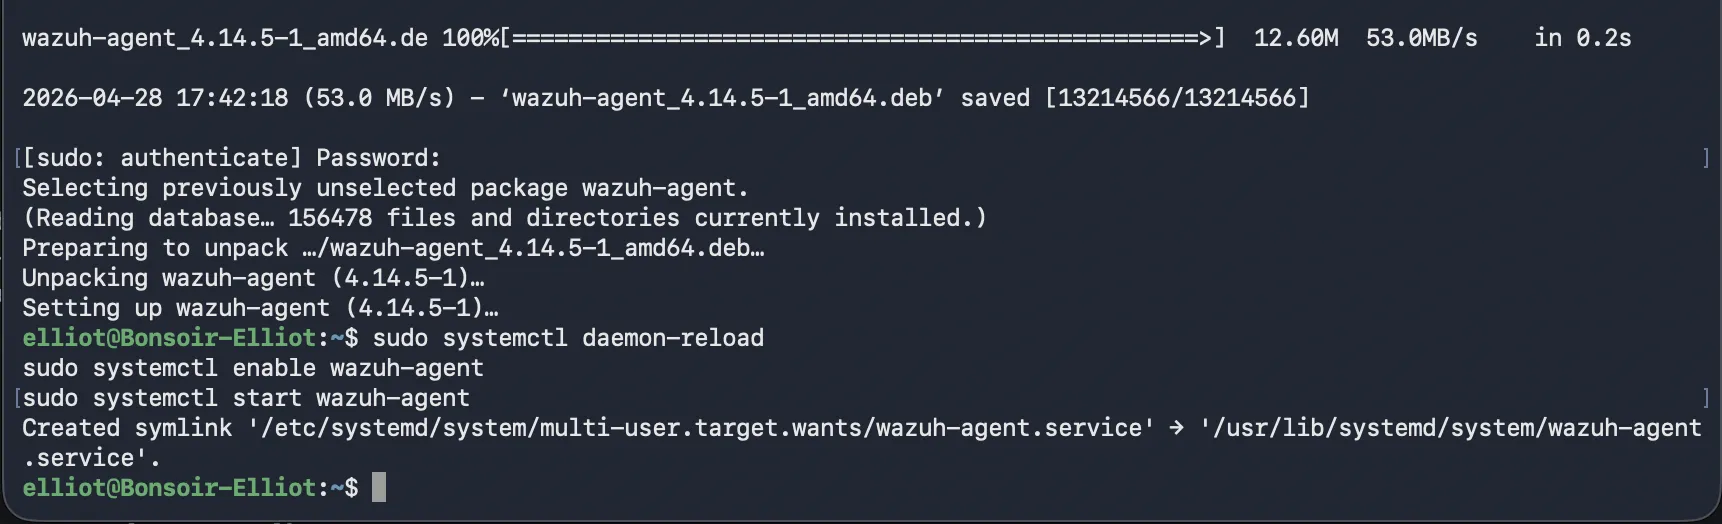 SSH terminal session on the Ubuntu Desktop VM. Running the wget command to pull the Wazuh agent package, then dpkg to install it, then setting the WAZUH_MANAGER environment variable to point at the server IP before enabling and starting the service.
Then I enabled and started the agent service:
sudo systemctl daemon-reload
sudo systemctl enable wazuh-agent
sudo systemctl start wazuh-agent
Flipped back to the Wazuh Dashboard and within about 30 seconds:
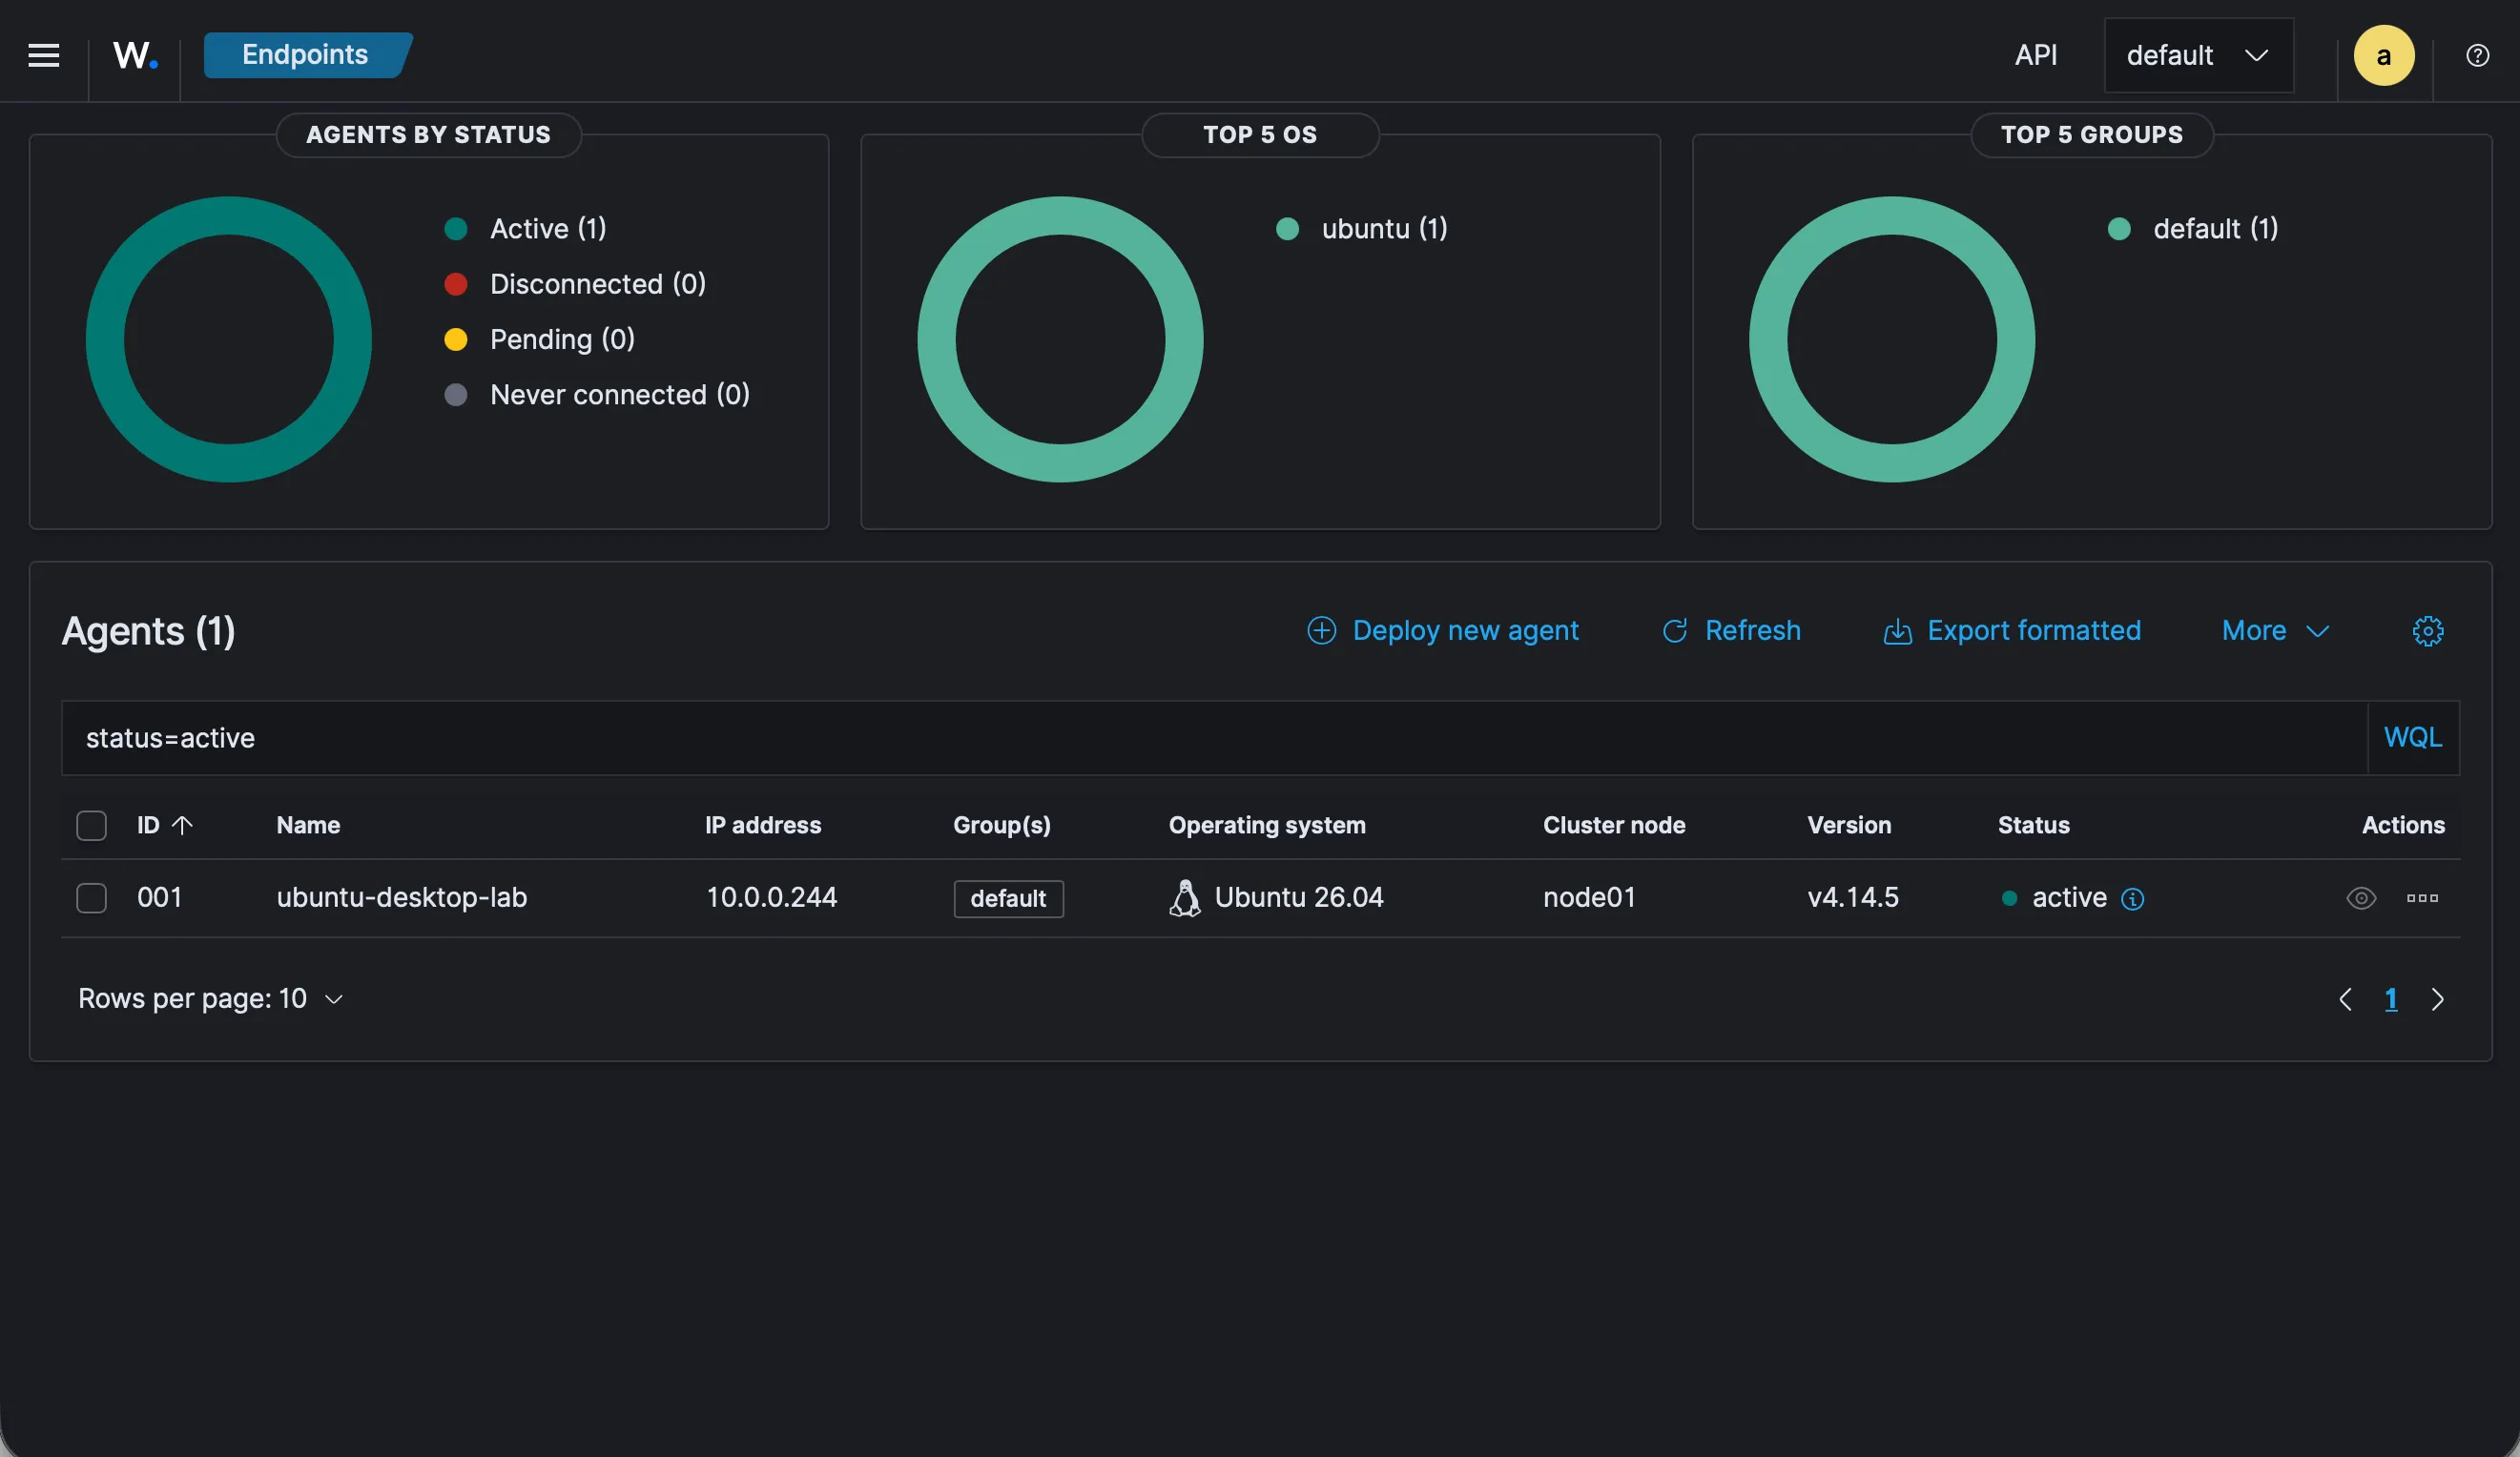 Wazuh Dashboard Agents page showing the Ubuntu Desktop VM as Active with a green status indicator.
Agent is live. Wazuh is collecting.
Things I Found Interesting
The Wazuh installation assistant script is actually well-written. Before running it, I skimmed through it to make sure it wasn’t doing anything sketchy. It’s not a curl-bash-blindly situation. The script checks your OS version, installs the right packages from Wazuh’s own signed repo, and configures each component with sane defaults. Worth a read if you’re deploying this in any environment you care about.
The other thing worth noting is the decision to keep all three components on a single node. The official Wazuh docs explain a distributed deployment where you’d split the Indexer, Server, and Dashboard across separate hosts for scalability and redundancy. For a production SOC deployment, that matters. For a homelab running a handful of agents? It’s unnecessary overhead. The single-node install is perfectly fine for what I’m doing here.
Wrapping Up
Wazuh is deployed, the first agent is connected, and data is flowing. The SIEM is up. But right now it’s basically running on defaults. The actual value comes from tuning the rulesets, writing custom detection rules, and integrating other data sources.
In part 3, I’ll go deeper into Wazuh configuration. Custom rules, decoder tuning, and getting Suricata events feeding in from OPNsense. 👀
References
- Wazuh Documentation: https://documentation.wazuh.com
- Wazuh All-In-One Install: https://documentation.wazuh.com/current/quickstart.html
- Ubuntu LVM resize after install: standard lvextend + resize2fs procedure